Help Instructions
The base entry of the phiSITE database is defined as a site, representing one
regulatory element present on a phage genome. This can be either
promoter, operator, transcription terminator or attachment site. Site
element can be segmented into several subsites (if known) - particular
cis-regulatory signals (e.g. -35 and -10 for prokaryotic promoter). The
database provides also references to the method of evidence for
experimentally confirmed sites. All sites are linked to the other
phiSITE tables describing the phage and its features. Information about
complete phage genome is also included (if available), together with
names and positions of all known genes. phiSITE keeps also updated
information about phage and phage host taxonomy, together with numerous
links to other database resources described in section "Phage genome
browser" below. There are also several accompanying analyzing tools
under development, accessible in the Tools section.
Browser Compatibility
phiISTE web portal conforms to XHTML-1.0-Transitional standard and
should work on all compliant browsers. phiGENOME browser (one part
of phiSITE portal) uses also other technologies (Adobe Flash, AJAX,
SVG). It was developed on MS Windows platform, where all major browsers
(Firefox, MSIE, Google Chrome, Safari and Opera) are fully supported.
Other operating systems were tested only partly and occasional bugs may
occur (e.g. problems with mouse scroll zoom). An Adobe Flash
Player plug-in 9.0 or higher is required to run phiGENOME browser with all
its functionalities. If mouse scroll function is not working for Mac
users, we advise to upgrade Adobe Flash plugin to the latest
version.
Following tests assess your browser compatibility issues:
phiSITE Sections Help
phiISTE database portal is devided into following sections described bellow:
HOME
This section provides general information about the phiSITE database portal.
SEARCH
Quick and Advanced Search
User can search the content of a database using Quick Search or Advanced Search.
Search terms are looked up either in all text fields (phage name, host
name, site name, site description or site type) or in a single field
selected by a user. In Advance Search, different search fields for each
search term can be specified, with an optional usage of wildcards
(wildcards are always used in Quick Search). Search results are provided
in a form of table with customizable order. Each entry includes site
name, link to the phiGENOME browser  and Regulation secton
  (if defined), site type (promoter, operator,
terminator or attachment site), method of evidence (
(if defined), site type (promoter, operator,
terminator or attachment site), method of evidence ( for experimentaly confirmed and
  for predicted sites), source
reference (PubMed article, book or EMBL entry), phage details and
semi-graphical representation of DNA segment containing the site. All
sites are linked to the Sequence Ontology
for predicted sites), source
reference (PubMed article, book or EMBL entry), phage details and
semi-graphical representation of DNA segment containing the site. All
sites are linked to the Sequence Ontology  thesaurus. Arbitrary number of
entries from search result page can be manually selected and exported
using browse and export module described below.
thesaurus. Arbitrary number of
entries from search result page can be manually selected and exported
using browse and export module described below.
Select
all |
↓ Name |
Type |
Evidence
Method |
Reference |
Phage |
Sequence |
|---|
|
PR
|
|
| PubMed | |
37978..38033
ACCGTGCGTGTTGACTATTTTACCTCTGGCGGTGATAATGGTTGCATGTACTAAGG |
BROWSE and Export
Set of phiSITE entries can be exported using dynamic browse and export module and used in
further analyses in a variety of bioinformatics tools. User can select a
group of sites according to the phage or
phage host taxonomic
hierarchy. Evidence (experimental, predicted or both) and site and
subsite types can be also selected. Each taxonomic selection
step is coupled with background counting of sites currently selected.
After selection, user has an option (i) to build motif representation
for selected sites, (ii) to export sites as FASTA sequences or (iii) to
export selected site in XML format. Selecting Build motif representation
is followed by a sequence alignment assembly process mediated by a
ClustalW2 algorithm and the motif is exported in several output formats:
TRANSFAC database, FASTA, Patser, PromScan, PWM (Postion Weight Matrix)
and Sequence logo. XML format is based on XML version 1.0 specification
and the output file is coupled with XML DOM document.
PHAGES
This section provides detailed information about phage taxonomy,
phage genome and phage gene regulation as well as numerous links to
other related databases. User can select the phage of interest from the
pull down menu. If the data are not available for the phage,
its name is in gray an can not be selected.
Features
Basic information about the phage is summarized in this table. Besides
the phage and phage host taxonomical classification, user is presented
with links to the EMBL, UniProt, Taxonomy, NCBI Genome, ViralZone and ICTVdb
databases. Dynamically generated list of phage related articles in PubMed
Central and two other internal links (BioTapestry Viewer  - see below, and direct
link to the list of all regulatory sites associated with a phage) are
also present.
- see below, and direct
link to the list of all regulatory sites associated with a phage) are
also present.
We have adapted BioTapestry
tool (Longabaugh et al. 2009) for visual representation of phage GRNs (Gene
regulatory networks). Gene regulation
interaction information is extracted from scientific literature and
entered into the model. Source type 'gene' is used for genes and gene
products, and source type 'box for regulatory sites. Several types of
interactions are described in the BioTapestry model: (i) initiation of
transcription of a gene from promoter, (ii) activation of transcription
by a product of phage gene, (iii) repression of transcription by a
product of a gene binding to the operator of target promoter, (iv)
repression of transcription by the operator negatively influencing
promoter, (v) termination of transcription initiated from the promoter
and (vi) antitermination of transcription by a product of antiterminator
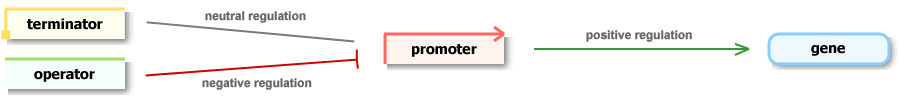
gene. Positive regulation is depicted as an arrowed line pointing from
the master to the slave element (i, ii, iii), negative regulations as a
'T' shaped line pointing to the slave element (iv, vi) and neutral
relation as a straight line between master and slave elements (v. Only
interactions among the phage genome elements are defined at the moment,
though future versions may include also phage host regulatory elements.
phiGENOME
The portal possesses proprietary graphical genome browser phiGENOME, which consists of
three components: (i) genome map viewer, (ii) sequence
browser and (iii) regulation illustrator.
Genome map viewer is a Flash application which provides dynamic
and interactive graphical display of phage genomes. Particular genomic
features (genes, promoters, operators, terminators) are depicted as
semi-transparent coloured boxes matching their real location and size
in a genome. Each type of genetic feature is assigned with a specific
colour (genes are blue; promoters are red; operators are green; terminators are yellow and attachment sites are purple). Mouse scroll
can be used to zoom in (and out) genome maps in order to perform
detailed inspection (up to the primary sequence level). The easiest way
to move along genome map is by using a drag-and-drop technique. Mouse
over a feature displays pop-up "tool tip" containing basic information
about the feature (feature's description, type and location). Selecting
arbitrary feature by mouse click makes this feature highlighted and
enables set of cross-referencing links associated with the feature. An
Adobe Flash Player plug-in 9.0 or higher is required to be installed
into user's web browser.
Sequence browser (based on
precisely formatted HTML tags) affords detailed exploration of genome
features on the sequence level. Genome features are highlighted in
colours which follow the colour scheme used in the Flash graphics.
Mouse over and mouse click events have the same effect as in the
genome map viewer. Unlike genome map viewer, only single
strand is displayed in the sequence browser, either direct (default
setting) or reverse-complement. User may choose whether genome features
from a single strand or from both superposed strands will be displayed.
To the left from the division of sequence browser, two expandable menus
are placed. The one of them comprehend general properties of the
displayed phage genome, the second menu contains links to external
databases with displayed phage genome. If the gene regulatory network
is defined for the phage, link to BioTapestry Viewer is also available.
Regulation illustrator, the third part of the
phiGENOME, was designed for graphical representation of regulatory
interactions between genes and cis-regulatory elements. For any
component of defined regulatory network, regulation illustrator
depicts the closest regulatory neighbours in the form of directed
acyclic graph. Vertices (icons) stand for individual components of the
regulatory network and edges (arrows) represent interactions between
them. Each type of genetic feature is represented by specific graphical
icon. The nature of regulations can be positive (represented by
green-coloured common arrows), negative (red T-shaped arrows) or neutral
(grey lines). Mouse click on any icon generates graph of regulations for
this element. User has an option to download PNG snapshot of any
regulatory scheme. For web browsers without native SVG support (e.g.
Microsoft Internet Explorer), installation of SVG plug-in is needed.
By default, all components of the phiGENOME user's interface
are enabled. Optional disabling of sequence browser and
regulation illustrator makes the browsing less data-intensive.

Regulations
This section provides graphical representation of regulatory
interactions between genes and cis-regulatory elements in the form of
directed acyclic graph (using SVG technology). Vertices (icons) stand
for individual components of the regulatory network and edges (arrows)
represent interactions between them. Selected element is represented by
the central icon; elements influencing this element are located on the
left; elements influenced by this element are located on the right.
Each type of genetic feature is represented by specific graphical icon.
The nature of regulations can be positive (represented by
green-coloured common arrows), negative (red T-shaped arrows) or neutral
(grey lines). Mouse over an icon displays tooltip with basic
description of the element. Mouse over an arrow shows tooltip text
containing the type of interaction. Mouse click on any icon generates
graph of regulations for this element. User has an option to download
PNG snapshot of any regulatory scheme. Using BioTapestry Viewer,
comprehensive regulatory networks are available. Particular subsets of
regulatory network are divided into separate graphical layers. These
regulatory subsets are based on the function of the genes, their
regulation and time of expression.
Legend
TOOLS
We provide few simple tools to be used for exploring gene regulatory
elements. Each tool is presented with its own help page accessible by
clicking the question mark.
PSSM-convert
The program for PSSMs creation and for conversion of PSSM formats.
FreeEnergy
The program for computation of Gibbs free energy distribution in DNA sequence.
PromoterHunter
Tool for promoter search in prokaryotic genomes.
LINKS
Web links related to gene regulation databases and tools.
DOWNLOAD
Content of the whole database can be downloaded in XML format.
PSSM-convert
tool is also available for download and off-line use.
HELP
This help page.
Any questions?
Please do not hesitate to contact the authors regarding any problems you
can encounter on the phiSITE portal.